Model : AOS81 & AOS82T
Optic Design : Non-Diffractive Wavefront – Enhanced EDOF Biconvex Aspheric 360° Square- Edge Design
Material : Hybrid Acrylic (Clear)
Optic Diameter : 6.00 mm
Overall Length : 13.0 mm
Haptic Design : Modified C- Loop
Refractive Index : 1.465
Abbe Number : 56
A- Constant : 118.5 ( SRK – T Optical ) & 118.2 (SRK – T US/Immersion)
Spherical Power Range : +10.00 to +30.00 D (with 0.50 D increments)
Cylindrical Power Range : +01.00 D to +6.00 D (with .50 D increments)
Model : AOS81 & AOS82T
Optic Design : Non-Diffractive Wavefront – Enhanced EDOF Biconvex Aspheric 360° Square- Edge Design
Material : Hybrid Acrylic (Clear)
Optic Diameter : 6.00 mm
Overall Length : 13.0 mm
Haptic Design : Modified C- Loop
Refractive Index : 1.465
Abbe Number : 56
A- Constant : 118.5 ( SRK – T Optical ) & 118.2 (SRK – T US/Immersion)
Spherical Power Range : +10.00 to +30.00 D (with 0.50 D increments)
Cylindrical Power Range : +01.00 D to +6.00 D (with .50 D increments)


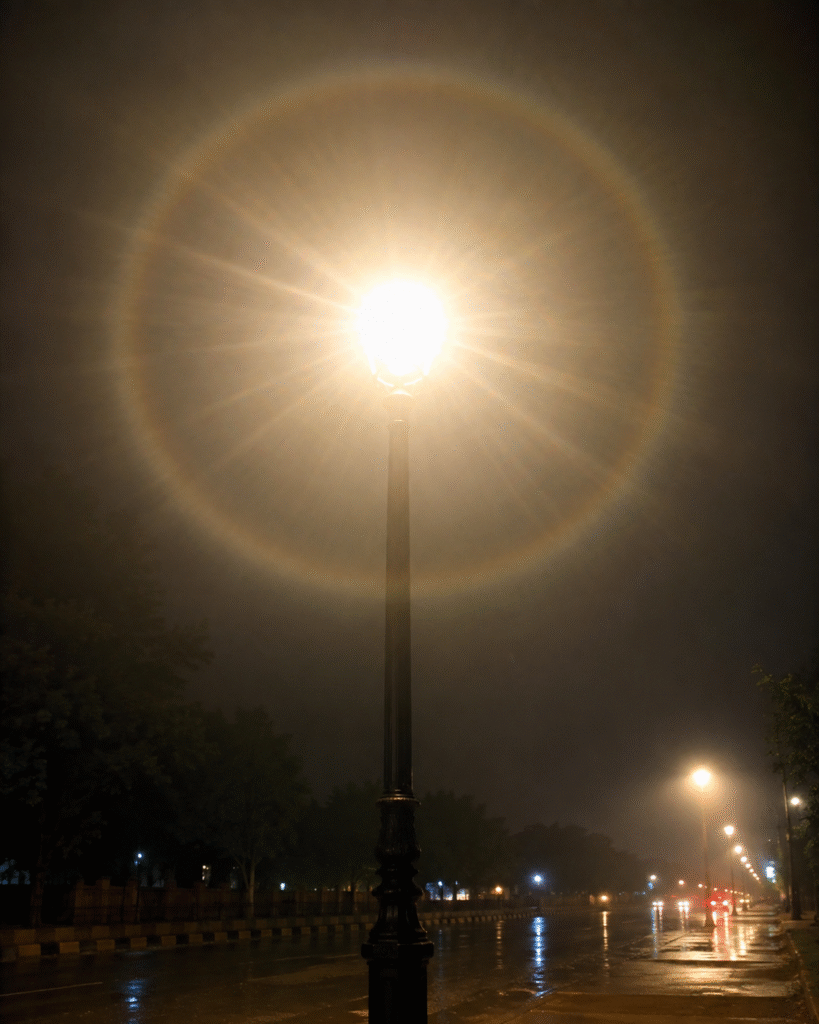
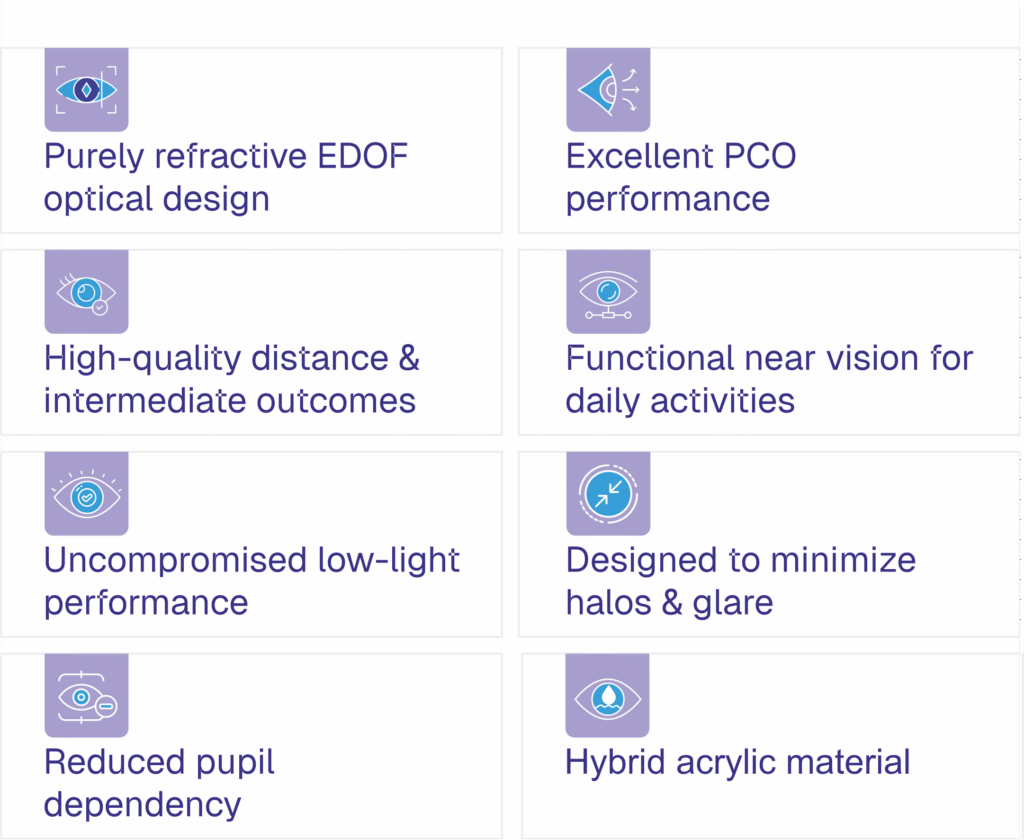
Designed to maintain monofocal -like visual quality under low – light conditions, while providing an extended range of vision in photopic conditions.
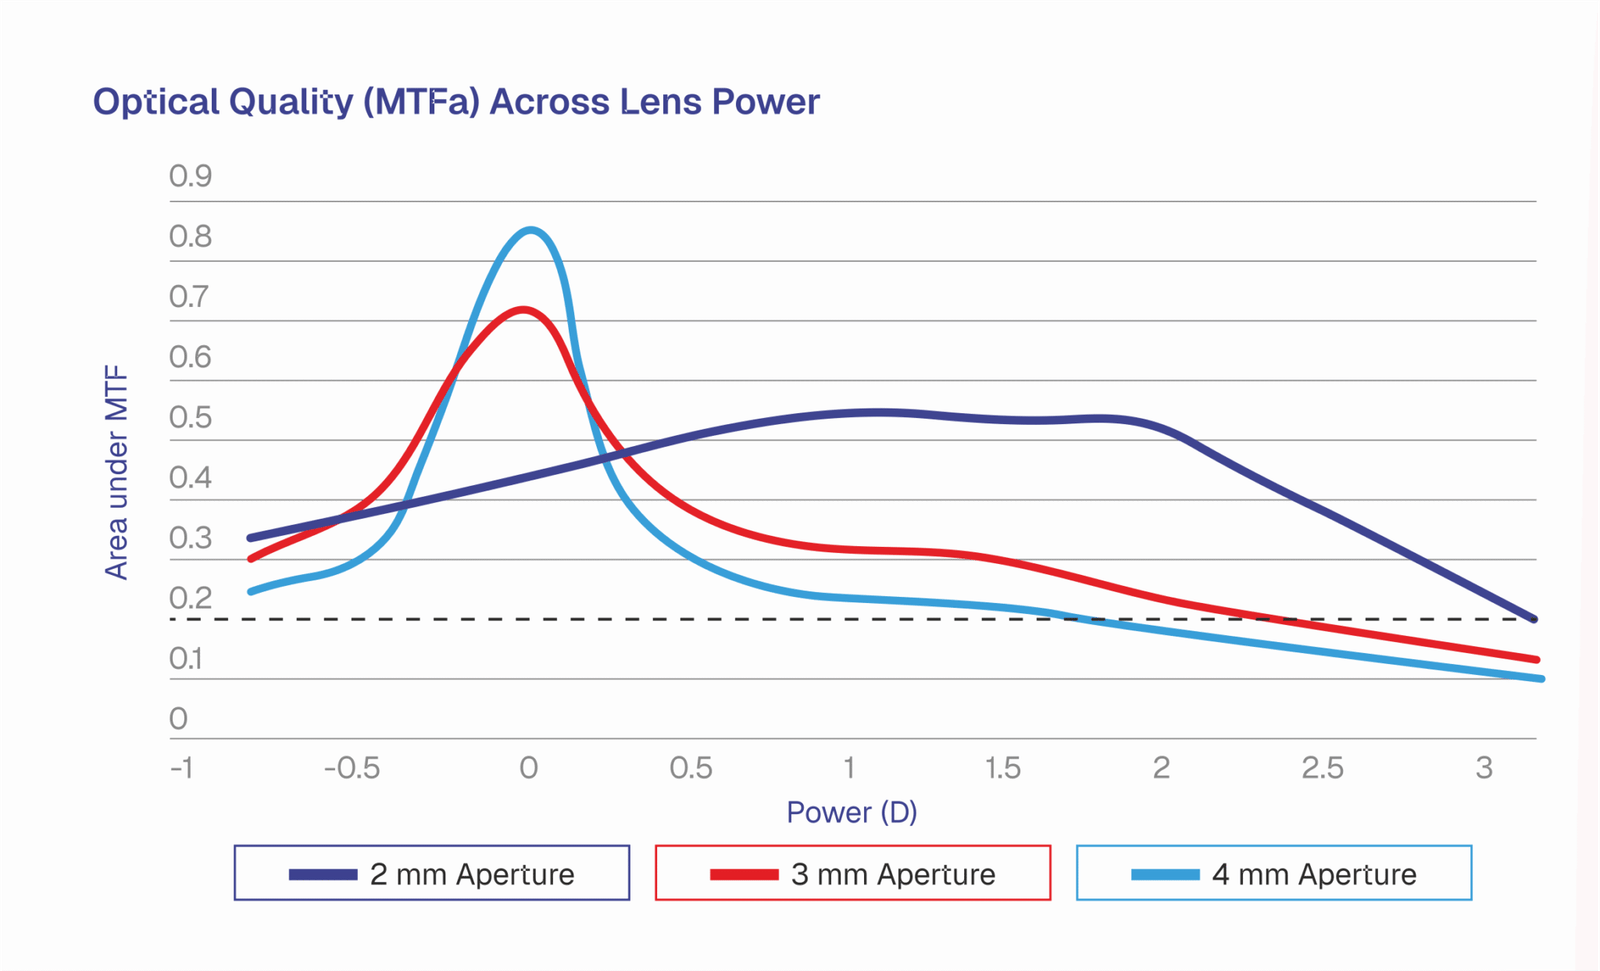
MTFa (Modulation Transfer Function Area) is an objective optical performance metric that quantifies the amount of image information transferred through an optical system over a range of spatial frequencies. Higher MTFa values indicate greater preservation of image contrast and detail under standardised optical bench testing conditions.
Extended Optical Performance
The optical bench evaluation demonstrates a broad distribution of Modulation Transfer Function Area (MTFa) across a continuous range of defocus, supporting functional image quality beyond a single focal position.
Optical performance was evaluated using 2 mm, 3 mm and 4 mm pupil apertures, representing different simulated pupil conditions. The measured MTFa profiles demonstrate consistent optical quality across the tested pupil diameters while maintaining an extended range of functional focus.
The gradual transition of MTFa across the defocus range reflects the lens’ continuous refractive profile, providing sustained image quality through distance and intermediate focal regions.
Functional Vision Threshold (MTFa 0.20)
The dashed reference line corresponds to an MTFa value of 0.20, a widely recognised benchmark for functional vision in optical bench assessment. The portion of each MTFa curve above this threshold represents the defocus range over which functional optical performance is maintained under standardized laboratory testing conditions.
MTFa correlates positively with visual acuity , illustrating high contrast sensitivity across extended focal ranges and pupil conditions.
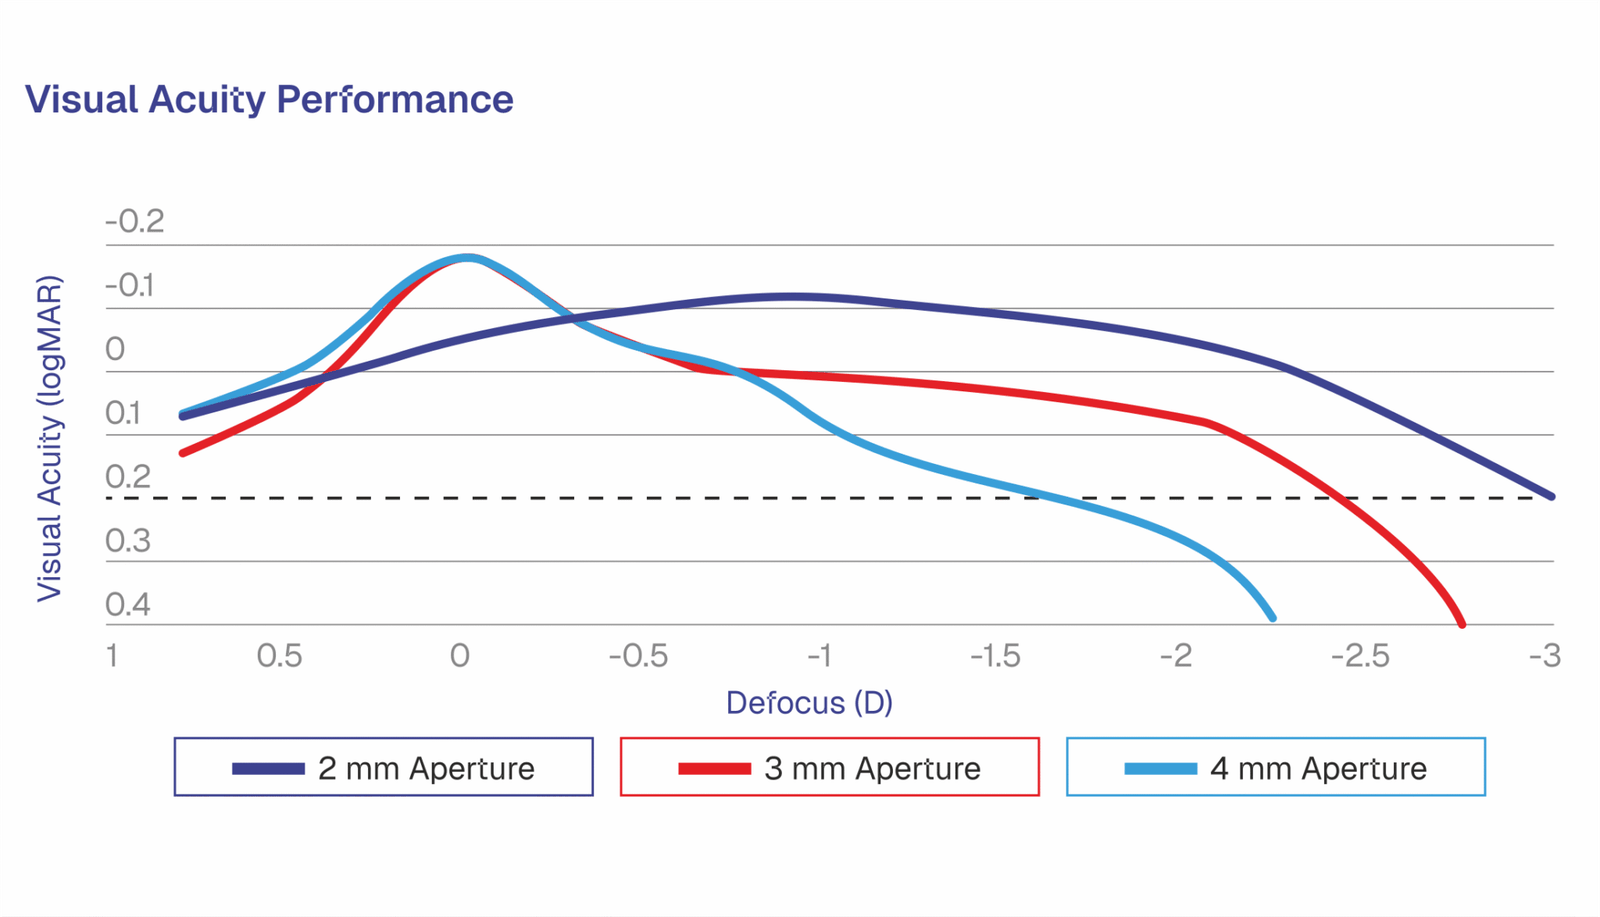
The defocus curve characterises visual acuity across a continuous range of vergences under standardised optical bench simulation. The measured profile demonstrates sustained visual performance from distance through intermediate defocus while maintaining functional visual acuity across multiple pupil diameters.
Visual acuity was evaluated using 2 mm, 3 mm and 4 mm pupil apertures, representing different simulated pupil conditions. The resulting defocus profiles characterise the lens’ optical performance over an extended range of focus.
Functional Vision Threshold
The dashed reference line at 0.2 logMAR (20/32 Snellen equivalent) represents a commonly accepted benchmark for functional visual acuity. The portion of each defocus curve above this threshold identifies the defocus range over which functional vision is maintained under the test conditions.